
Gurgaon, also known as Gurugram, looks very different on paper than it did a decade ago. Prices have not moved evenly across its corridors, and infrastructure delivery, employment growth, housing demand and new development have all played a part, though rarely at the same pace or the same time.
This blog covers the verified price data, the market phases behind it, locality-wise rates, the factors driving appreciation and the indicators buyers should watch.
Quick Answer
Gurgaon prices moved through distinct phases rather than in a straight line: an early period of regulatory change, a COVID-driven slowdown, a recovery, an infrastructure and premium-housing phase, and a more selective current phase. The clearest data covers Q1 2020 to Q1 2025, when average residential prices rose from around ₹6,150 per sq ft to ₹11,300, a gain of roughly 84% in five years. Quoted rates have continued to rise since, and levels differ widely between corridors.
|
Note: The table summarises the broad market cycle and is indicative rather than a single price series.
Gurgaon Property Rates for 10 Years: Historical Price Trend
Gurgaon Real Estate Price Appreciation History
Average residential rates in Gurgaon climbed from roughly ₹6,150 per sq ft in Q1 2020 to ₹11,300 in Q1 2025, an overall increase of about 84% and a CAGR of roughly 13% over the five-year period.
Prices have kept rising since: quoted rates in Dwarka Expressway and New Gurugram were each up about 4% on the previous quarter in Q1 2026.
Why Different Datasets Show Different Results
A separate tracker put Gurugram's average price at about ₹14,650 per sq ft for July to September 2024, up 76% over two years. That sits well above the Q1 2025 figure above. Gaps like this typically reflect different project baskets, weightings and definitions; some trackers, for instance, report quoted base prices on built-up area. Both measures reflect quoted or listed prices rather than registered transaction prices.
Gurgaon Real Estate Market Trends and Phases Explained
-
2016 to 2018: Early Period
- The period was marked by regulatory changes including RERA and GST, alongside continued buyer caution following demonetisation.
-
2019 to 2020: Slowdown and COVID-19 Disruption
- The pandemic disrupted construction, financing and buyer sentiment, and sales and construction activity slowed.
-
2021 to 2022: Recovery
- Housing demand rebounded after the pandemic slowdown.
-
2023 to 2024: Infrastructure and Premium-Housing Growth
- Gurugram prices rose 76% in the two years to July to September 2024, with Dwarka Expressway's infrastructure progress cited as boosting demand in newer sectors.
-
2025 to 2026: Current Market Phase
- Growth has continued at a steadier pace, while higher premium pricing and concentrated luxury supply have become more visible.
The Gurgaon Property Price Cycle
Underneath these phases runs a repeating pattern, expansion, rising demand, price growth, new supply chasing that growth, consolidation, then renewed growth or correction depending on how well supply and demand balance. Different corridors can sit at different points on this cycle at the same time, so a single citywide reading can mislead.
Gurgaon Property Rates Sector-Wise: Locality Comparison
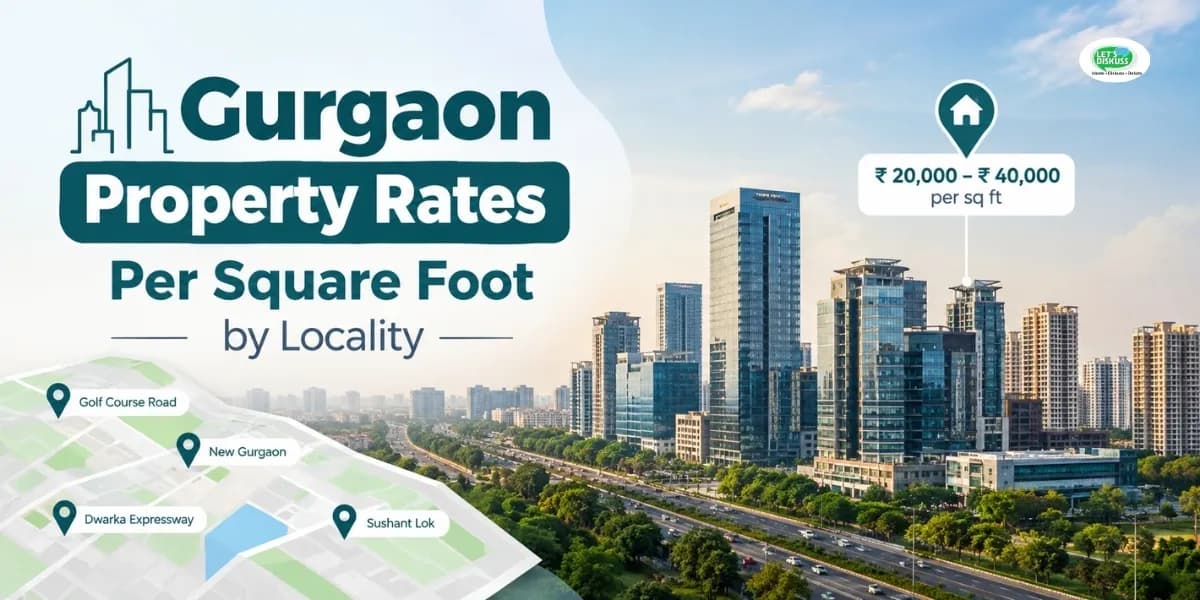
Citywide figures blur the differences that matter most to a buyer. The corridors below sit at noticeably different price levels today:
| Locality | Current indicative rate | Rate basis |
|---|---|---|
| DLF Phase 1 | ₹17,800/sq ft | Listing-based average flat rate |
| DLF Phase 3 | ₹21,800/sq ft | Listing-based average flat rate |
| Golf Course Road | ₹27,800/sq ft | Listing-based average flat rate |
| Golf Course Extension Road | ₹19,550/sq ft | Listing-based average flat rate |
| Sohna Road | ₹15,550/sq ft | Listing-based average flat rate |
| Dwarka Expressway | ₹14,000/sq ft | Anarock quoted base rate, Q1 2026 |
| New Gurgaon | ₹13,300/sq ft | Anarock quoted base rate, Q1 2026 |
Disclaimer: Listing-based figures are averages drawn from property listings. They change frequently and should be rechecked before use. Quoted base rates are averages of quoted base prices on built-up area.
-
DLF Phase 1 and DLF Phase 3
- Current listing data places Phase 3 at a higher rate than Phase 1, with its proximity to Cyber City being one factor that may support demand. Both are long-established DLF colonies.
-
Golf Course Road and Golf Course Extension Road
- Flats on Golf Course Road average ₹27,800 per sq ft, against ₹19,550 on Golf Course Extension Road. The extension corridor has seen considerable development and price growth as newer residential supply expanded along it.
-
Dwarka Expressway Property Rates
- Dwarka Expressway has seen substantial development, particularly as its infrastructure progressed, and over the period covered it has moved from an emerging corridor toward a more established residential market. The quoted base rate in Q1 2026 was ₹14,000 per sq ft, up about 4% on the previous quarter.
-
New Gurgaon Property Rates
-
The quoted rate for New Gurugram in Q1 2026 was ₹13,300 per sq ft, also up about 4% quarter-on-quarter. Listing-based averages for New Gurgaon flats run lower, at roughly ₹10,950, another illustration of how datasets differ.
Why Gurgaon Property Prices Have Appreciated
Gurgaon property price growth comes down to a mix of demand- and supply-side forces rather than a single cause. The main factors driving Gurgaon real estate appreciation cited in published data include:
- Employment and commercial growth: Delhi NCR accounted for 21.6% of India's gross office leasing in Q2 2026.
- Infrastructure and connectivity: The market outlook cites Dwarka Expressway, the Delhi-Mumbai Expressway and metro expansion as reshaping NCR demand.
- Premium housing demand: premium-segment demand remains sustained in Gurugram, and luxury and high-end housing formed about 60% of NCR launches in Q1 2026.
- Rental demand: quoted rents rose about 2% quarter-on-quarter in both Dwarka Expressway and New Gurugram in Q1 2026.
- Limited land in established corridors, which can support pricing where new supply is constrained.
- Infrastructure-led expectations, where announced projects can lift prices before delivery.
Demand drivers, such as employment and rental demand, explain why buyers want property; supply-side factors, such as land availability and new launches, determine how far that demand lifts prices. A corridor can have real demand and still see muted growth if supply keeps pace.
Gurgaon Property Price Index and Circle Rates
Gurgaon Property Price Index
A property price index tracks prices relative to a fixed base year rather than reporting an absolute ₹ per sq ft figure. Gurgaon price figures are published by private market trackers, which use different methodologies and property baskets. An index is best read alongside locality-level price data, not treated as a direct Gurgaon-wide ₹/sq ft rate.
Gurugram Circle Rates vs Market Rates
| Aspect | Circle rate | Market rate |
|---|---|---|
| What it represents | Government-notified valuation | Actual asking or transaction price |
| Main use | Stamp duty and registration calculations | Determined by prevailing market conditions |
| How often it changes | Revised periodically by notification | Can move continuously |
Haryana's revised collector (circle) rates for 2026-27 took effect on 1 April 2026, with the change varying by area. The two figures are not interchangeable: a corridor's circle rate can be revised well before or after market prices move.
Gurgaon Property Prices in 2026: Current Market Direction
Prices across Gurgaon in 2026 still differ widely by locality, property segment and project quality. The present market combines ongoing price growth with more selective buyers and wider gaps between established and emerging corridors.
Is Property Rate Going Down in Gurgaon?
The latest quarterly data do not show a broad decline. Quoted rates in Dwarka Expressway and New Gurugram are each up about 4% on the previous quarter, and Gurugram accounted for about 43% of NCR sales despite a 5% quarterly dip. Averages can still hide softer individual projects, and quoted prices are not registered transaction prices.
Are Property Prices Expected to Fall in 2026?
Published data points in both directions. NCR sales were up 21% year-on-year in Q1 2026 and inventory overhang eased to 18 months, and the published outlook expects sustained NCR growth through 2026. Against that, NCR sales fell 8% quarter-on-quarter, Gurugram holds about 45% of NCR's available inventory, and luxury and high-end housing made up about 60% of NCR launches. The balance is likely to differ from one corridor to the next.
Is Gurgaon Real Estate Overpriced Compared With Its Historical Average?
It depends on the benchmark and the property. A more useful approach compares current prices against several reference points, including the locality's own history, achievable rental yields, recent transaction prices, land values, pipeline supply and local affordability.
How to Assess Whether a Gurgaon Property Is Overpriced
- Compare the asking price with recent resale transactions in the same project or corridor, not the developer's launch price.
- Check whether achievable rent comes anywhere close to justifying the price.
- Separate infrastructure benefits already delivered from those still promised.
- Weigh the price against similar nearby projects; very few completed resales is itself a warning sign.
What Does Gurgaon's 10-Year Appreciation Tell Buyers?
- Past appreciation is not a guarantee; treating a decade of gains as a promise is a common buyer mistake.
- Sources use different methodologies, project baskets and base years, which is why published Gurgaon figures often differ.
- Quoted and asking prices can differ from transaction prices, especially in resale deals.
- Locality averages hide project-level differences, and a ten-year CAGR can mask long stretches of stagnation.
- Infrastructure can be priced in before delivery, and carpet-area and super built-up rates for the same flat will never match.
What Buyers Should Monitor Going Forward
Rather than predicting prices, track indicators that tend to move first: new supply by corridor, sales volumes, unsold inventory, project-level rental yields, employment growth, infrastructure delivery against timelines, interest rates and developer delivery records.
Frequently Asked Questions (FAQ)
How have Gurgaon property prices changed in the last 10 years?
Is property rate going down in Gurgaon?
What is the future of Gurgaon real estate?
Are property prices expected to fall in 2026?
Is Gurgaon real estate overpriced?
Is it good to invest in Gurgaon?
How will Gurgaon real estate evolve in 2026?
What is the 2% rule for properties?
What are the current property rates in Gurgaon?
What is the Gurgaon property price index?
Key Takeaways
- Gurgaon residential prices recorded substantial growth between Q1 2020 and Q1 2025, though pace and scale differed by corridor.
- The decade moved through phases, from regulatory change and a COVID slowdown to recovery, an infrastructure-led phase and a more selective present.
- Corridors sit at very different price levels today, and no single citywide figure describes them all.
- Employment, infrastructure, housing demand and new supply are commonly cited drivers, and their effect differs by corridor.
- Gurgaon's 2026 market shows different conditions across premium, emerging and supply-heavy segments.
- Ten years of appreciation is not a forecast; methodology differences, quoted-versus-transaction gaps and project-level variation mean locality-level data matters more than any citywide figure.